Cut Line Plot
1. Overview
The Cut Line Plot feature allows users to extract a one‑dimensional slice of data from a two‑dimensional device simulation. By defining either a horizontal or vertical cut through the device, you can inspect internal physical quantities along that line.
Cut line plots are especially valuable when investigating behaviours that may be difficult to discern in conventional contour or colour‑map plots. They also provide a clear way to monitor how a quantity changes with bias or time, such as the variation of electron or hole concentration along a device channel.
2. Usage Instructions
- Ensure the required result file(s) are loaded. If the file you wish to use has not yet been loaded, click here for instructions on how to add result files.
- Click the
Cut Line Plotbutton. This will open the plot view along with the associated settings panel. - Configure the plot settings. Within the settings panel, specify the details of the plot you wish to generate. See parameters for detailed description of each setting.
- Click the
Plotbutton to generate and display the selected data on the chart. - To include additional datasets, repeat Step 3 and then select
Add to Plot. The newly defined data will be overlaid onto the existing chart. - To export the plotted data for further analysis or reference, click the
Export Databutton. The data will be saved in a .csv file format. - Click the
Clear Plotbutton to remove all data from the chart.
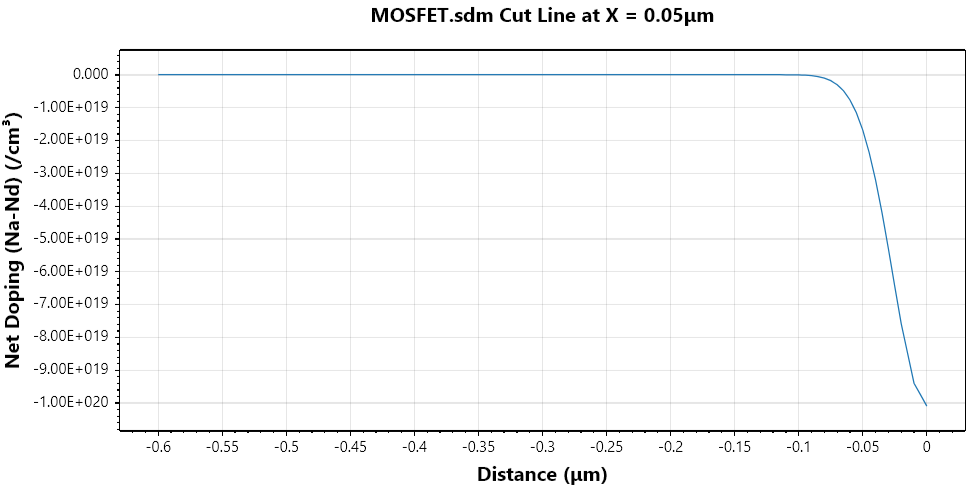
Plot of net doping for a MOSFET along a vertical line through the source contact.
3. Parameters
| Name | Description | Unit |
|---|---|---|
File | The file to plot data from (.sdm or .res). | - |
Device | Specifies the device to plot when using a result file containing multiple devices. | - |
Variable to Plot | Variable to be shown on the plot. | - |
Case Number | Specifies which point from the simulation to plot results from. Depending on type, this is a voltage, current or time step. | - |
Orientation | Specifies whether the cut line is taken as a vertical or horizontal slice. | - |
Cut Location | The X or Y coordinate at which the cut is taken. | μm |
Include Oxide | Specifies whether oxide region(s) should be included in the plotted data. | - |
Show Tick Marks | Displays markers at the sampled data points on the plot. | - |
Absolute Values | Plots the absolute value of the selected variable. | - |
Log Scaling | Applies a logarithmic scale to the y‑axis. | - |
Min Value Threshold | Sets the smallest value allowed on the logarithmic scale. Any data points below this threshold will be clipped to this value to avoid issues with log transformations. | - |