Contour Plot
1. Overview
The Contour Plot feature allows users to generate a fully filled, two‑dimensional contour representation of physical quantities across a device.
This plotting mode is ideal for highlighting spatial variations such as depletion regions, high‑field locations, charge‑carrier distributions, thermal gradients, or other physical effects that may not be immediately apparent from 1D plots. When combined with mesh overlays or oxide‑inclusion options, contour plots offer an intuitive and detailed view of internal device behaviour under different bias or time conditions.
2. Usage Instructions
- Ensure that the desired result file is loaded into the Results Visualiser. If you need help loading files, click here.
- Click the
Contour Plotbutton to open the contour‑plot view and its associated settings panel. - Configure the plot parameters, including variable, case number, log scaling, oxide inclusion, or contour limits. See the parameters section for details.
- Click
Plotto generate the filled contour plot using the selected settings. - Optionally adjust mesh visibility, scaling options, or custom contour ranges to refine how the physical data is displayed.
- Use
Export Datato save the underlying plotted values to a .csv file. - Click
Clear Plotto remove the current contour plot and reset the view.
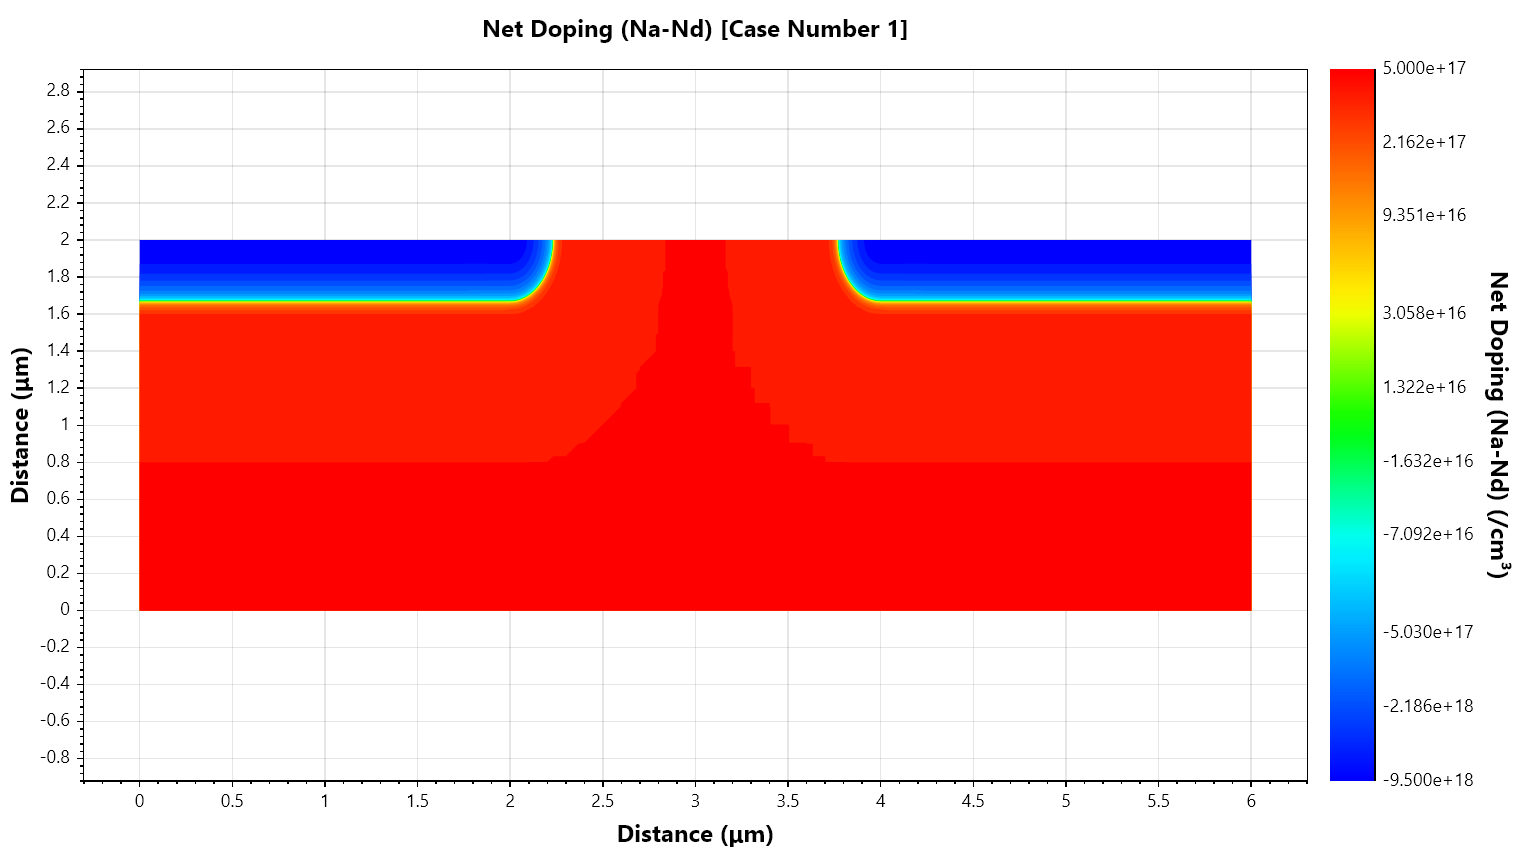
Plot of net doping for a MOSFET.
3. Parameters
| Name | Description |
|---|---|
File | The file to plot data from (.sdm or .res). |
Device | Specifies the device to plot when using a result file containing multiple devices. |
Variable to Plot | The physical variable to visualise. |
Use Square Axis | Forces the plot to use a 1:1 aspect ratio so the device is displayed with equal scaling in X and Y, exactly “as it is” in physical space. |
Case Number | The simulation point to plot. Depending on the simulation type, this corresponds to a voltage, current, or time step. |
Show Mesh | Overlays the finite element mesh on top of the contour plot. |
Include Oxide | Includes any oxide regions if present. |
Log Scaling | Applies logarithmic scaling to the contours. |
Min Value Threshold | Minimum value used for logarithmic scaling to avoid issues with zeros or negative values. |
Custom Contour Limits | Allows specifying fixed minimum and maximum values for the contour colour range. |
Min Value | Minimum contour value when custom limits are enabled. |
Max Value | Maximum contour value when custom limits are enabled. |