External Plot
1. Overview
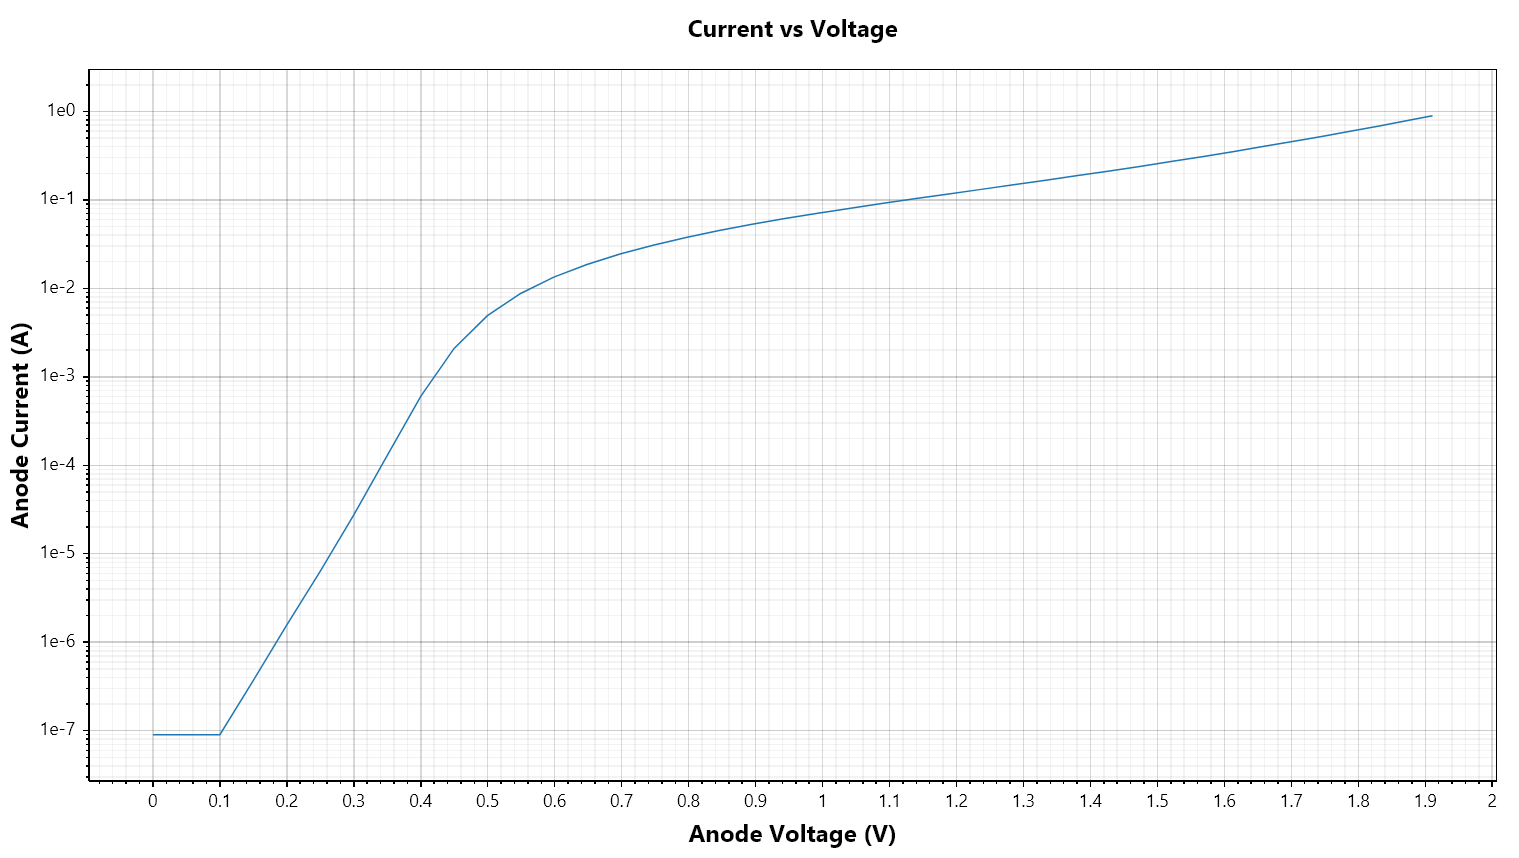
The External Plot feature enables users to visualise circuit‑level quantities such as terminal voltage, current, and charge as produced at the device contacts. These plots provide a clear view of how the device interacts electrically with its environment, making them essential for analysing I–V behaviour, operating points, and overall terminal characteristics.
2. Usage Instructions
- Ensure the required result file(s) are loaded. If the file you wish to use has not yet been loaded, click here for instructions on how to add result files.
- Click the
External Plotbutton. This will open the plot view along with the associated settings panel. - Configure the plot settings. Within the settings panel, specify the details of the plot you wish to generate. See Quantities Available for Visualisation for detailed description of each value.
- Click the
Plotbutton to generate and display the selected data on the chart. - To include additional datasets, repeat Step 3 and then select
Add to Plot. The newly defined data will be overlaid onto the existing chart. - To export the plotted data for further analysis or reference, click the
Export Databutton. The data will be saved in a .csv file format. - Click the
Clear Plotbutton to remove all data from the chart.
3. Parameters
| Name | Description | Unit |
|---|---|---|
File | The .res file to plot data from. | - |
X Axis Contact | The contact to use for the X axis data. | - |
X Axis Variable | Data to plot on the X axis. | - |
Y Axis Contact | The contact to use for the y axis data. | - |
Y Axis Variable | Data to plot on the Y axis. | - |
Show Tick Marks | Show the points on the plot with a dot. | - |
Log Scaling | Use a logarithmic scale for the heat map. | - |
Min Value Threshold | The minimum value for the log scale. Useful for data that is 0 in parts of the device. | - |